Check out our Customer Lifetime Value Colab to see how you can leverage ML Observability for your models!Documentation Index
Fetch the complete documentation index at: https://arize-ax.mintlify.dev/docs/llms.txt
Use this file to discover all available pages before exploring further.
Set up a Baseline and Monitors
In just a few clicks, Arize automatically configures monitors that are best suited to your data to proactively detect drift, data quality, and performance issues.
-
Datasets:
Training Version 1.0 -
Default Metric:
RMSE, Trigger Alert When:RMSE is above 80 - Turn On Monitoring: Drift ✅, Data Quality ✅, Performance ✅
Exploring model and feature drift
Visualize feature and model drift between various model environments and versions to identify LTV patterns and anomalous distribution behavior. Arize provides drift over time widgets overlaid with your metric of choice (in our case, RMSE) to clearly determine if drift is contributing to our performance degradation.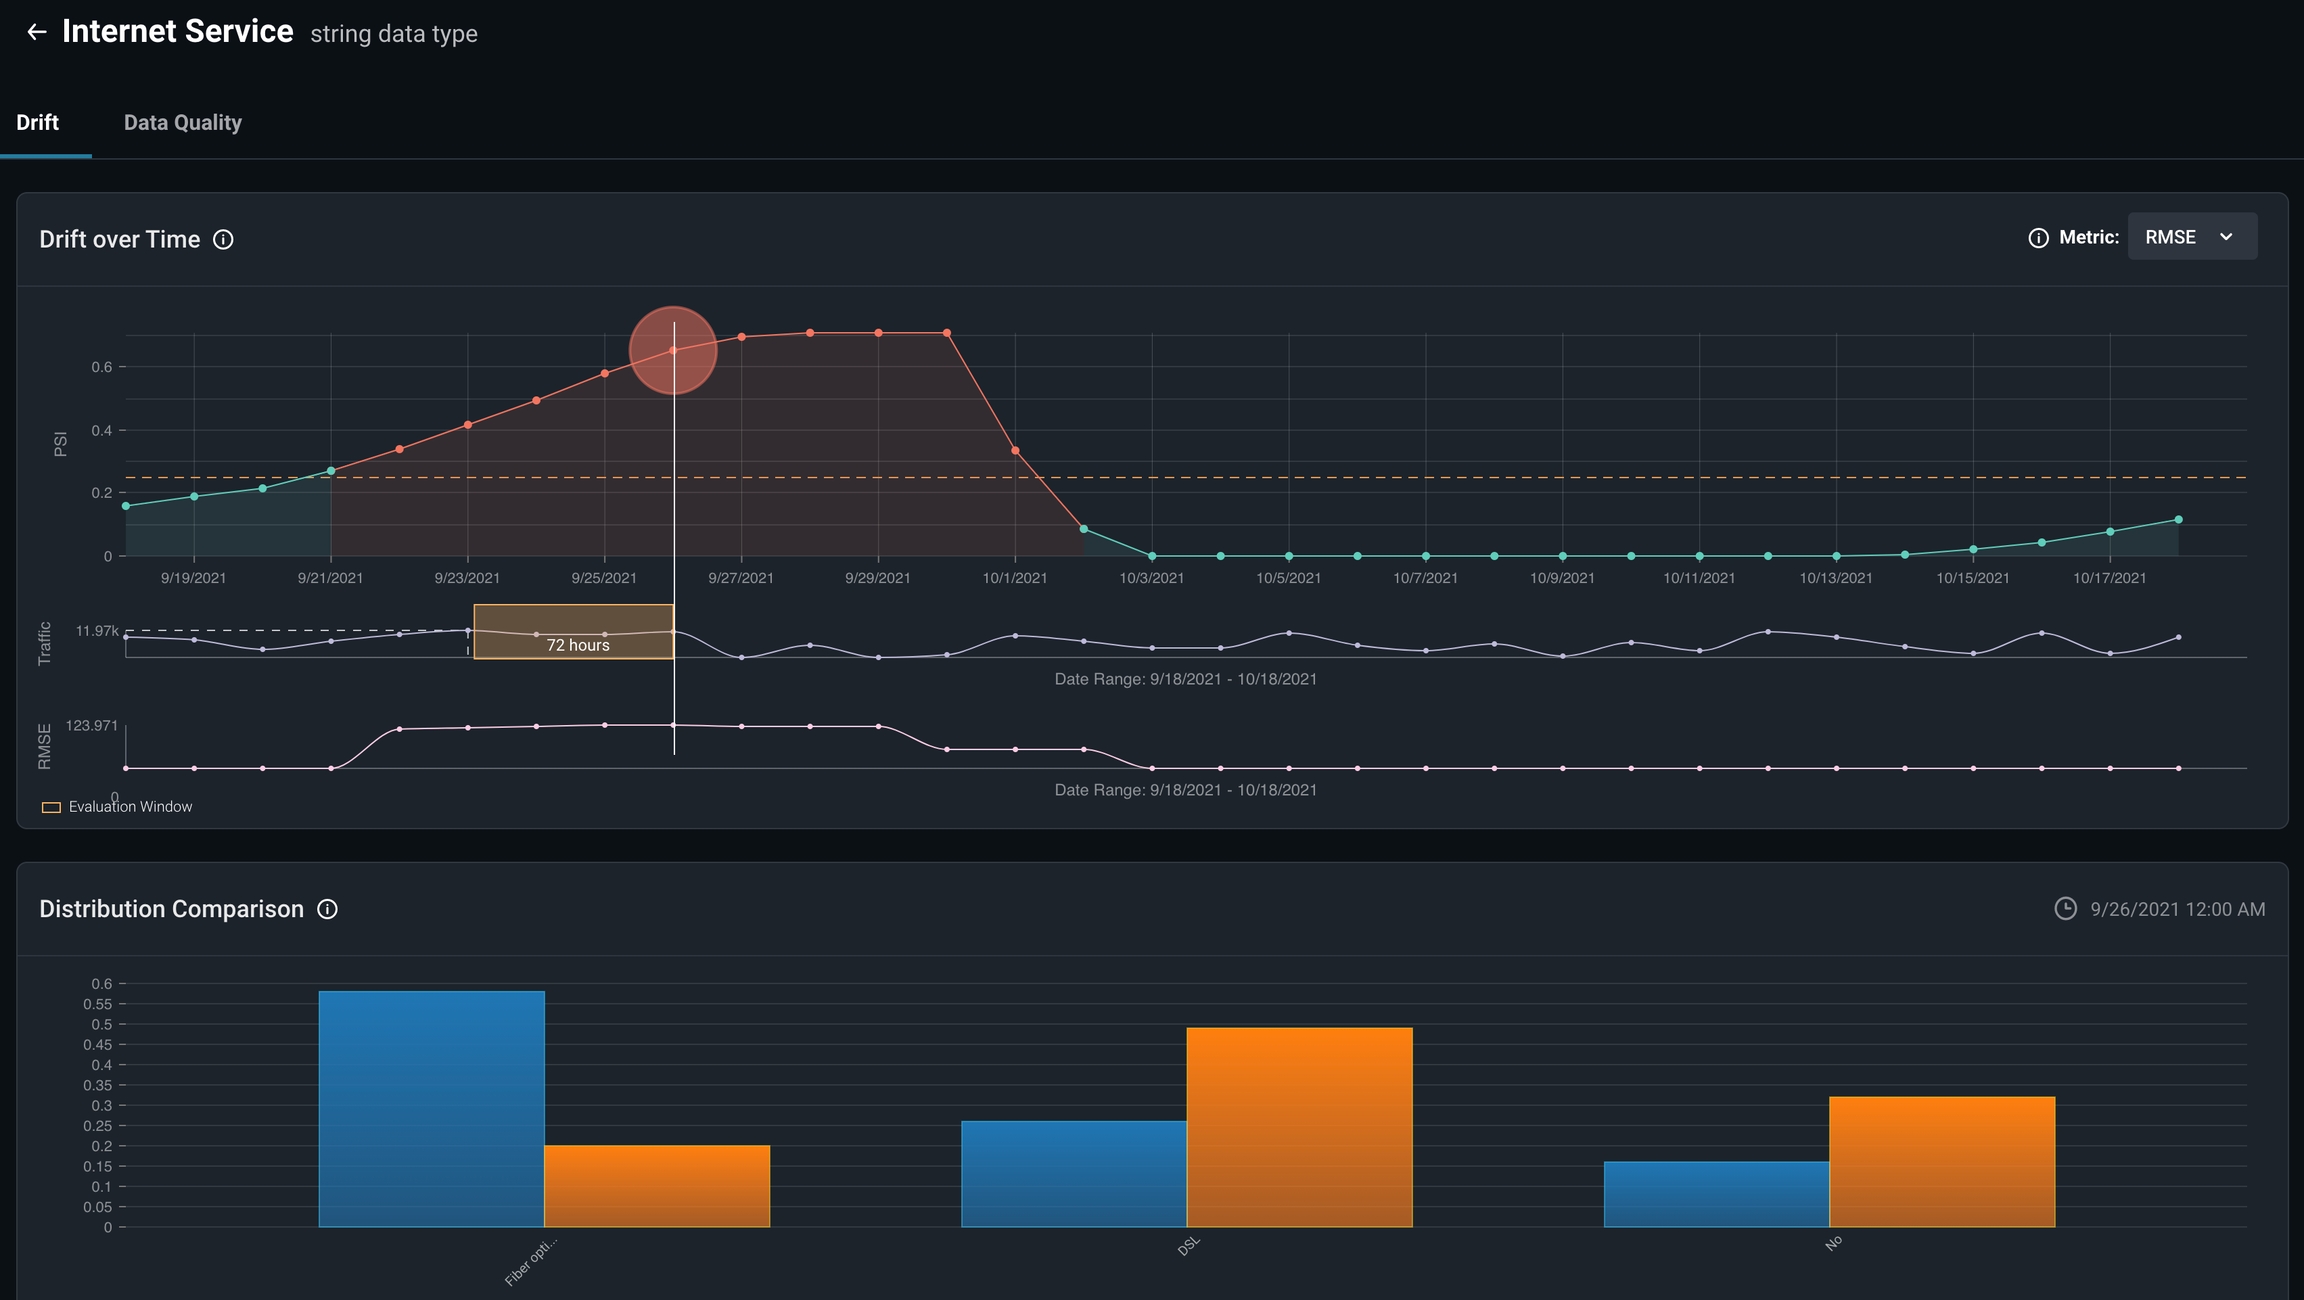
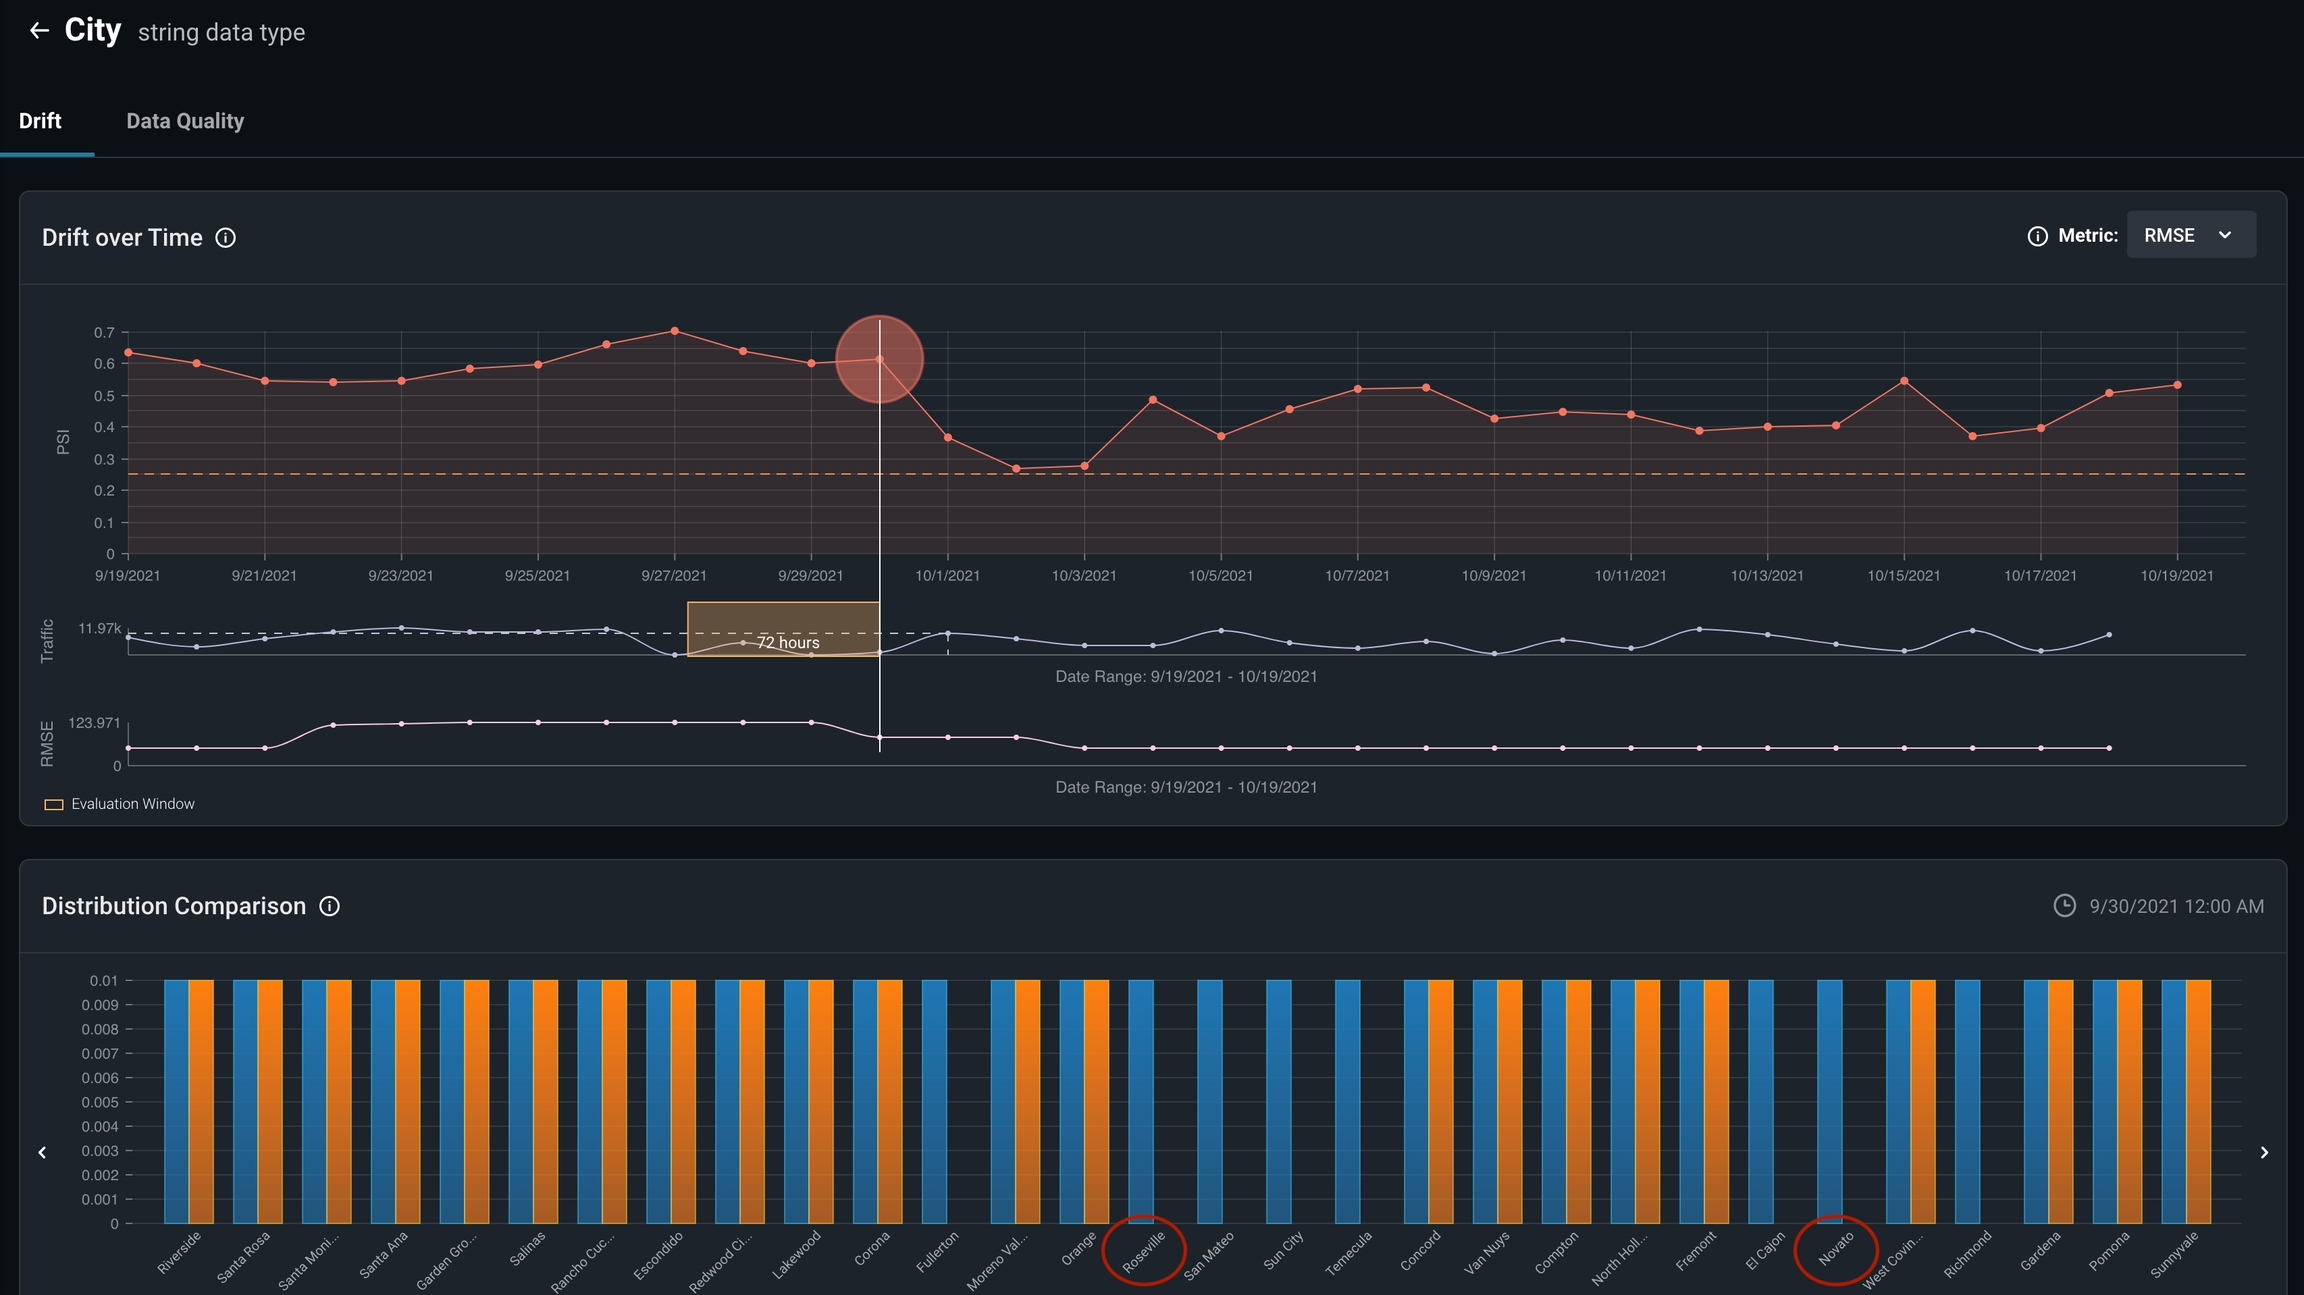
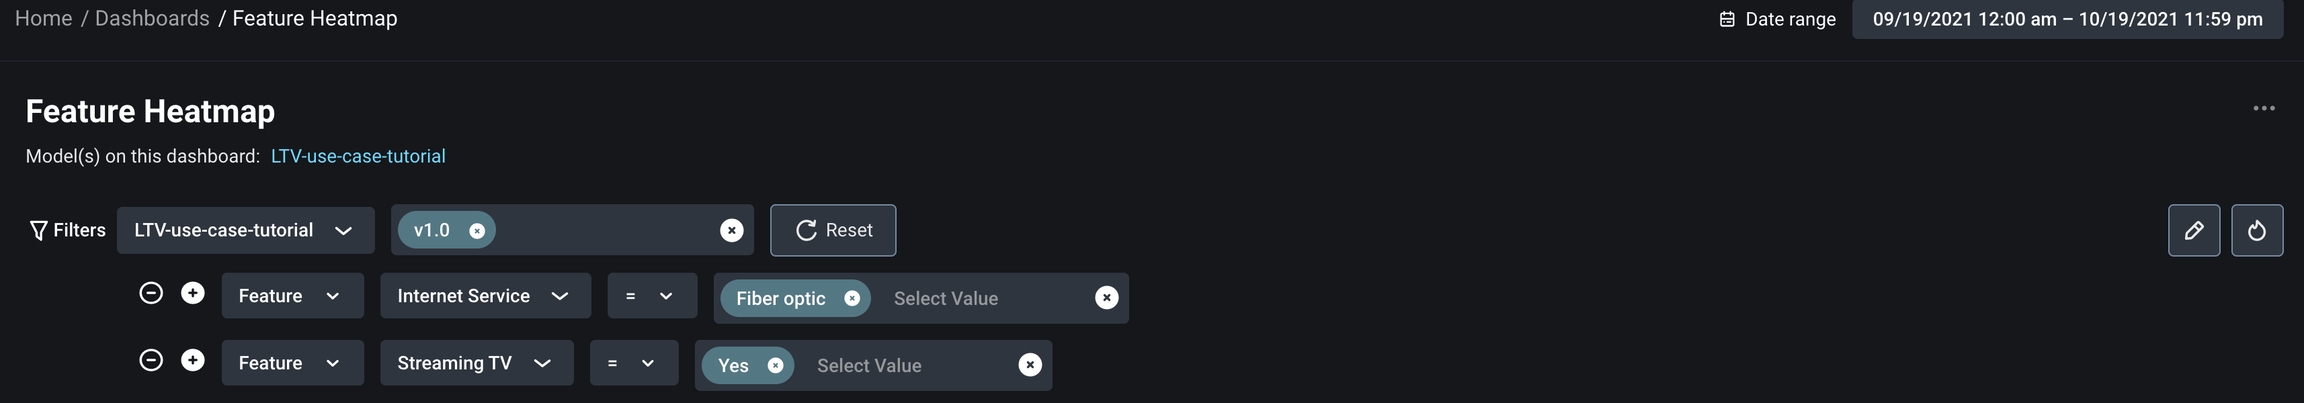
Analyzing root cause for low performing cohorts
Arize empowers automatic drill down on low performing slices (feature/value combinations) through the Feature Performance Heatmap.
Fiber Optic in Internet Service and Yes in Streaming TV across Cities.
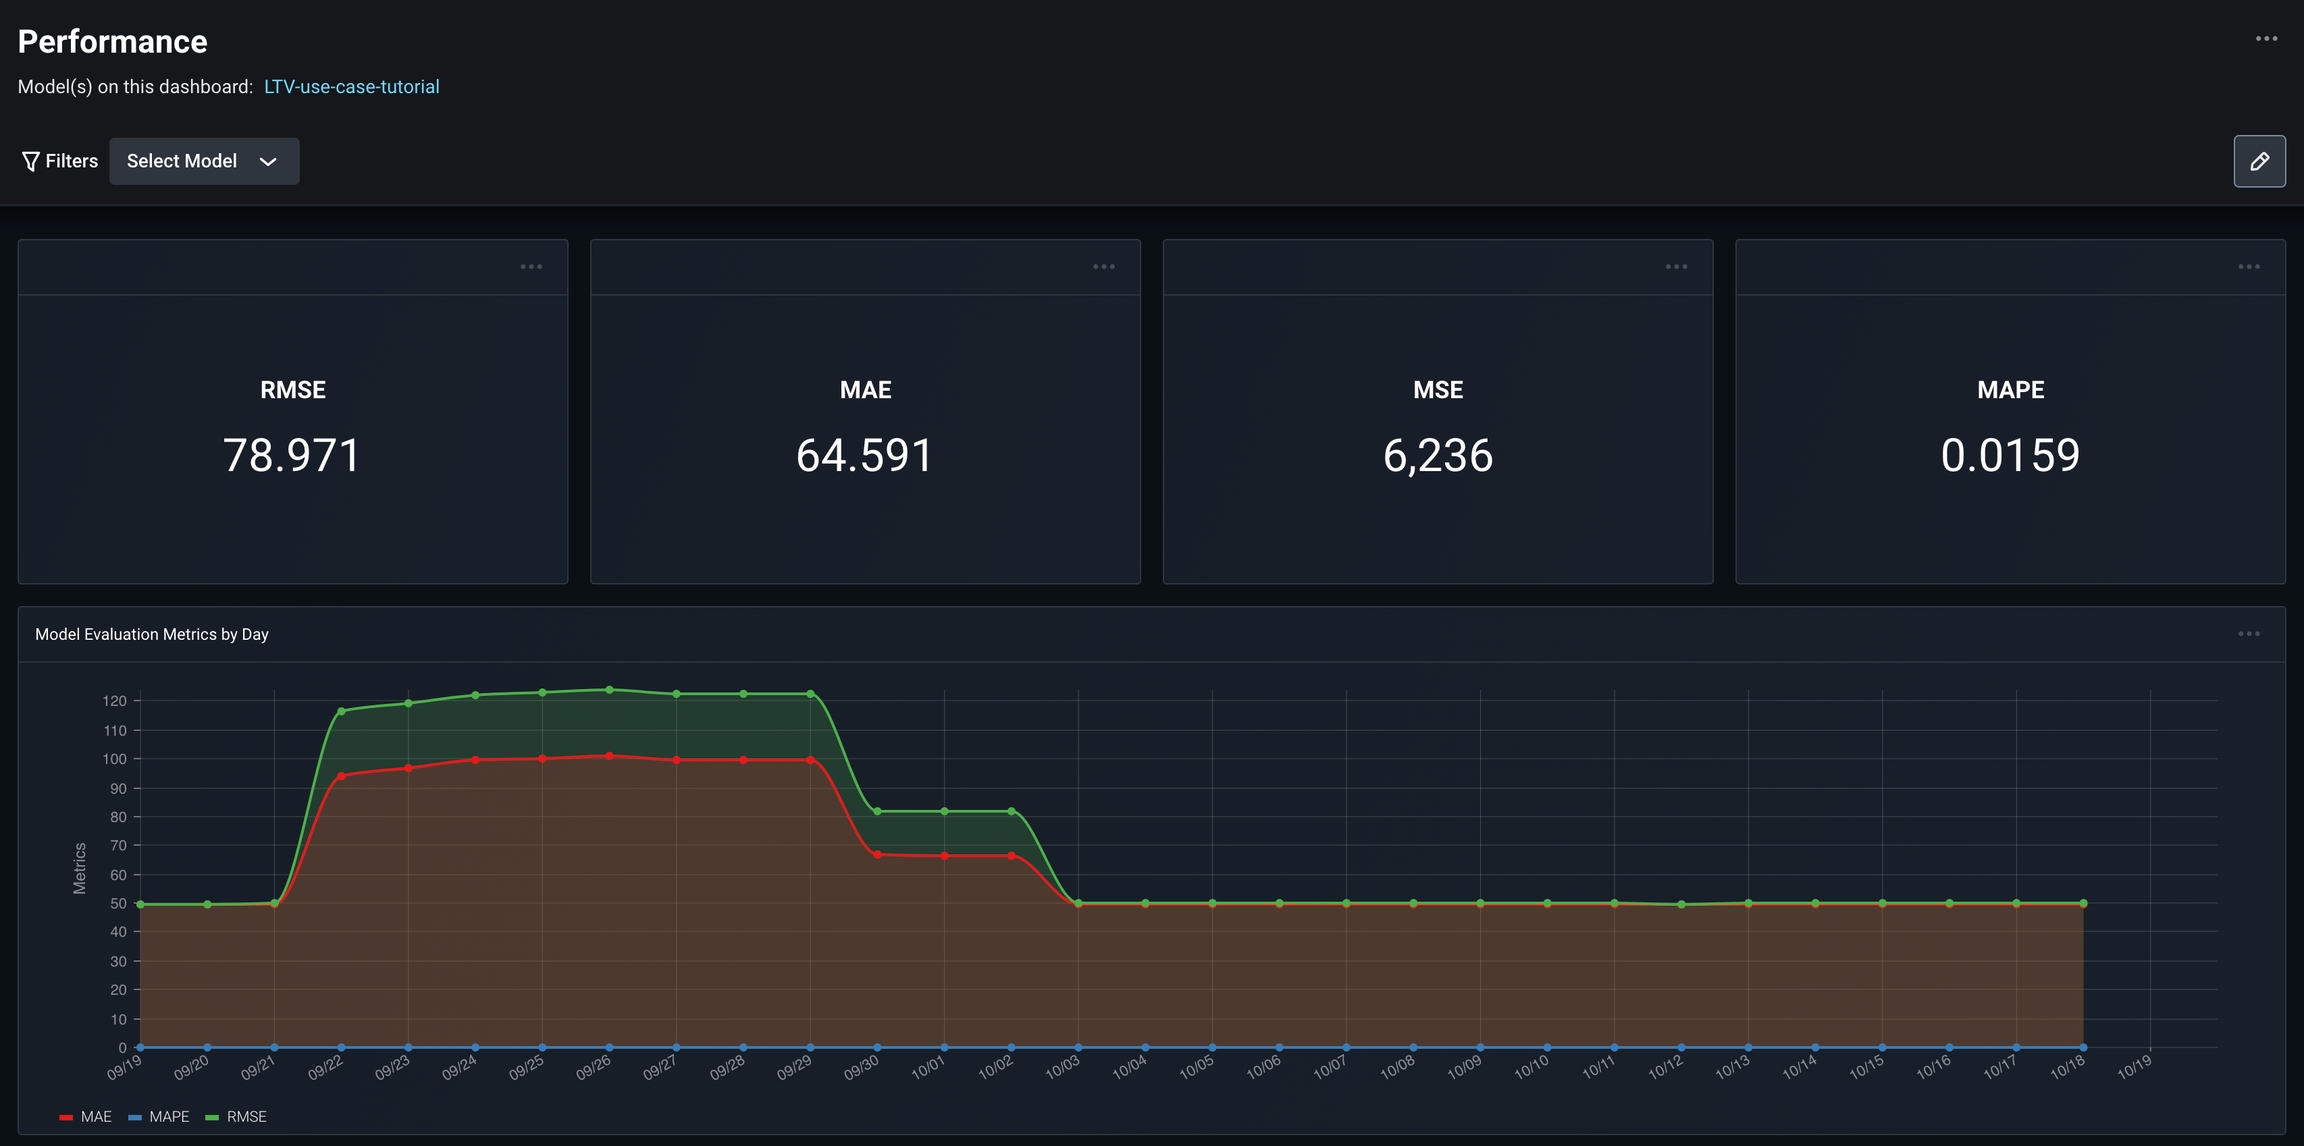
Model Performance Dashboard
As we continue to check in and improve our model’s performance, we want to be able to quickly and efficiently view all our important model metrics in a single pane. Use our Regression Model Performance Dashboard to set up a customizable dashboard for a single glance view of your model’s important metrics. In the case of LTV, we look at the model’s RMSE, MAPE, and MAE values.