

AgentExecutor agents are all traced by one setup.
Overview
In this guide you will instrument a LangChain agent, run it, and read the resulting traces in Arize AX. The following steps apply to any app built on LangChain, whether it runs behind a web framework such as FastAPI or Express, in a background worker, or as a script. This guide assumes familiarity with:- Python or TypeScript, including
async/await - Building an agent with LangChain’s
create_agentand tools - Environment variables and package installation
- Capture agent runs, model calls, and tool calls as traces
- Group traces by conversation using session IDs
- Verify and read the trace tree in Arize AX
Before you start
You need:- An existing agent built with LangChain
- An Arize AX account (sign up)
- An API key for one of LangChain’s supported model providers; this guide uses Anthropic.
Get your Arize AX credentials
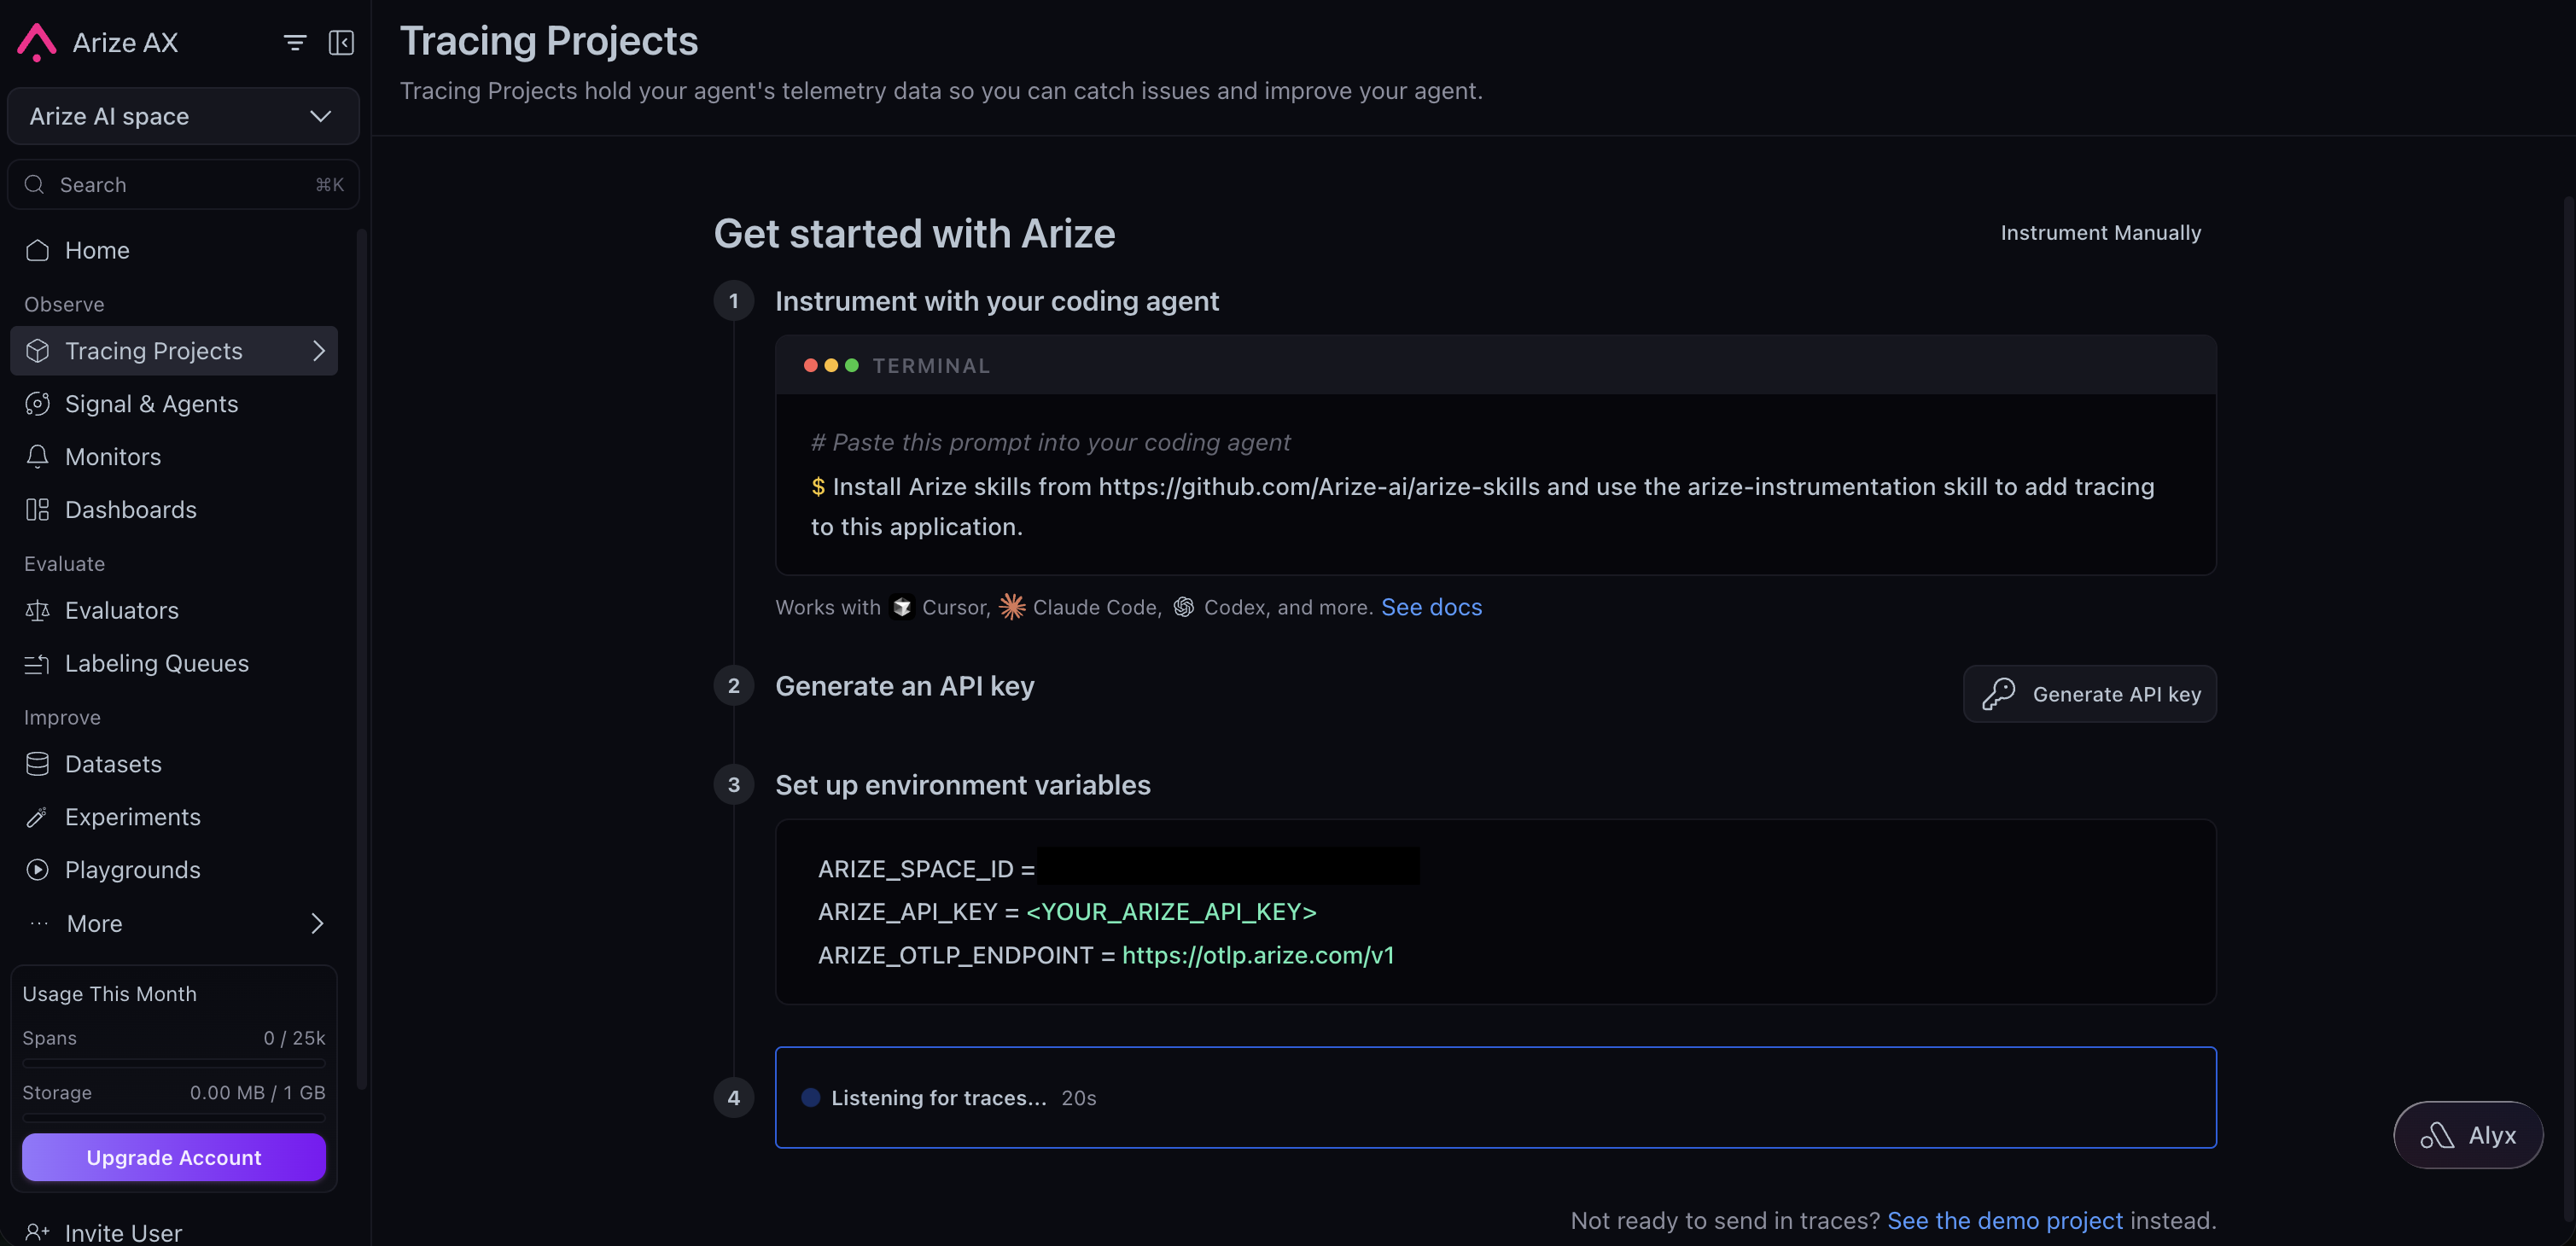
Sign in to your Arize AX account and open Tracing Projects. If you already have a project, click New Tracing Project. If you don’t, follow the steps under Get started with Arize, then click Generate API key and copy the pre-filled environment variables. Set them asARIZE_SPACE_ID and ARIZE_API_KEY when you configure your environment to route your traces to the correct space.
- Python
- TypeScript
Prerequisites: Python 3.10 or later.
1
Install the instrumentor
Install the OpenInference instrumentor for LangChain alongside the framework and tracing dependencies. This example uses Anthropic as the model provider; swap
langchain-anthropic for the provider package your agent uses.2
Configure credentials
Set your Arize AX and model-provider credentials as environment variables. The tracing setup reads them at startup, so you keep secrets out of your source.
ARIZE_PROJECT_NAME is the project your traces land in. Name it for the app so runs stay grouped where you expect them.3
Initialize tracing before LangChain runs
Set up tracing in a dedicated module so it runs once, before your agent code imports LangChain. Import this module before any
register() builds a tracer provider from your Arize credentials, and LangChainInstrumentor().instrument(...) connects that tracer to LangChain so every run emits spans.tracing.py
langchain or langchain_anthropic import in your entry point, so LangChain is instrumented before your agent runs. Importing the tracing module first is the simplest way to guarantee that ordering.main.py
If your app serves the agent from a web framework such as FastAPI or Flask, the LangChain instrumentor is still what captures the agent. Web-framework instrumentation only records HTTP requests, not the agent, model, and tool activity that make up an agent trace.
4
Run your agent
Run your app; either behind a web server, in a worker, or through the LangGraph dev server. Because you set up the instrumentation in the previous steps, the run is traced automatically. The example below is a small agent built with Each tool the agent invokes appears as a child span under the run, with its inputs and outputs. The model is interchangeable: swap the
create_agent and one tool. Running this agent captures a full trace of the agent run, each model call, and the tool call.anthropic:claude-sonnet-4-6 identifier for another provider string such as openai:gpt-5.5 or google_genai:gemini-3.5-flash, and the same instrumentor covers it.5
Avoid losing traces when a script exits
A long-running service, such as a web server or worker, keeps exporting spans as it runs, so you can skip this step. It applies only to a process that exits right after a run, such as a script, a batch job, or a serverless function.Spans are sent to Arize AX in the background, in batches, and a short-lived process can quit before the last batch goes out. Force that final send, a step called flushing, before the process ends so no traces are lost.
tracing.py exposes the provider it built, so import it and flush.6
Group traces by conversation
Auto-instrumentation captures each run on its own. To follow a multi-turn conversation as a single thread, add a session ID to Every span emitted inside the block carries the same
handle_turn and wrap the agent call in the using_session() context manager. Reuse the same ID across a conversation’s turns, such as the user or thread ID.session.id, so both turns share one session and Arize AX groups them into a single conversation you can replay.7
Verify in Arize AX
Open your Arize AX space and select the project you set in
ARIZE_PROJECT_NAME. Within about 30 seconds of a run, a new trace appears with a LangGraph root span wrapping ChatAnthropic LLM spans and one TOOL span per tool the agent invoked. When you set a session ID, each span carries session.id. See What gets captured for the full breakdown.If no traces appear, see Troubleshooting.What gets captured
The LangChain instrumentor records the full shape of each agent run:- Agent run. A
LangGraphroot span for the wholecreate_agentinvocation, wrapping every step the graph takes.create_agentruns on LangGraph, so the root span carries theLangGraphname. - LLM spans. One span per model call, with the input messages, the response, the model name, and token counts. This is where each reasoning turn and each tool-calling decision is recorded.
- Tool spans. One TOOL span per tool invocation, with the tool name, inputs, and outputs, so you can see what the agent decided to do and what each tool returned.
- Chain spans. The graph nodes and runnable structure that connect the model and tool steps, so the trace tree mirrors your agent’s control flow.
- Session grouping. The
session.idyou set, which threads related runs into one conversation.
Trace tool usage
Tool calls are traced automatically. Becausecreate_agent runs the model-and-tools loop itself and every step flows through LangChain’s callback manager, the instrumentor captures both the model’s decision to call a tool and your application executing it. You do not add manual spans, unlike a raw provider SDK where the instrumentor sees only the model call.
Each tool the agent invokes becomes its own TOOL span, a child of the agent run:
tool.nameis the tool that ran, such assuggest_workout.input.valueholds the arguments the model passed, such as{"goal": "cardio"}.output.valueholds what the tool returned, so you can see the exact result fed back to the model.
Chains and legacy agents
The instrumentor from this guide covers the rest of LangChain with no extra setup. LCEL chains such asprompt | model | parser are traced as a RunnableSequence span wrapping the prompt, model, and parser steps. The prebuilt create_react_agent and legacy AgentExecutor agents are traced the same way, with no change to the setup.
Troubleshooting
- Python
- TypeScript
- No traces in Arize AX. Confirm
ARIZE_SPACE_IDandARIZE_API_KEYare set in the same shell that runs your app. Enable OpenTelemetry debug logs withexport OTEL_LOG_LEVEL=debugand rerun. - Spans missing.
LangChainInstrumentor().instrument(...)must run before anylangchainimport. Make sure your tracing module is the first import in your entry point. - Trace is cut off or empty in a script. Spans export in the background. Call
tracing.tracer_provider.force_flush()before a short-lived script exits so the last batch is sent. session.idnot on spans. The instrumentor does not set session or user IDs on its own. Wrap the agent call inusing_session()(andusing_user()if needed) fromopeninference.instrumentation.401or404from your model provider. Verify the provider API key is set and valid, and that your key has access to the model your agent requests.
Next steps
Set up sessions
Group multi-turn runs into conversations with session and user IDs.
Customize your traces
Attach metadata, tags, and custom attributes to your spans.
Evaluate agents
Score tool selection, tool results, and goal completion.
LangChain integration
The reference pages for the LangChain instrumentor in Python and TypeScript.