

Overview
In this guide, you will auto-instrument the LiteLLM SDK, add manual spans around your agent’s loop and tools, and read the resulting trace tree in Arize AX. Then, you will route the LiteLLM Proxy to Arize AX to capture every model call that flows through the gateway. The two layers work together. The instrumentor captures each model call automatically, while the loop and the tool executions are your own code, so you wrap those in manual spans. Combined, they produce one trace that shows what the agent decided and what each tool returned, not just the raw model calls. This guide assumes familiarity with:- Python
- The LiteLLM completion API and the tool-use loop (
completion,tool_calls, tool results) - Environment variables and package installation
- Auto-instrument LiteLLM so each
completion()call is captured as an LLM span - Add manual AGENT and TOOL spans so the loop and tool executions appear in the trace
- Group traces by conversation using session IDs
- Trace the LiteLLM Proxy gateway with its native Arize AX callback
Before you start
You need:- An existing agent built with LiteLLM
- An Arize AX account (sign up)
- A key for one of LiteLLM’s supported providers. LiteLLM routes to the provider named in the
modelstring, soanthropic/...readsANTHROPIC_API_KEY,openai/...readsOPENAI_API_KEY, and so on.
Get your Arize AX credentials
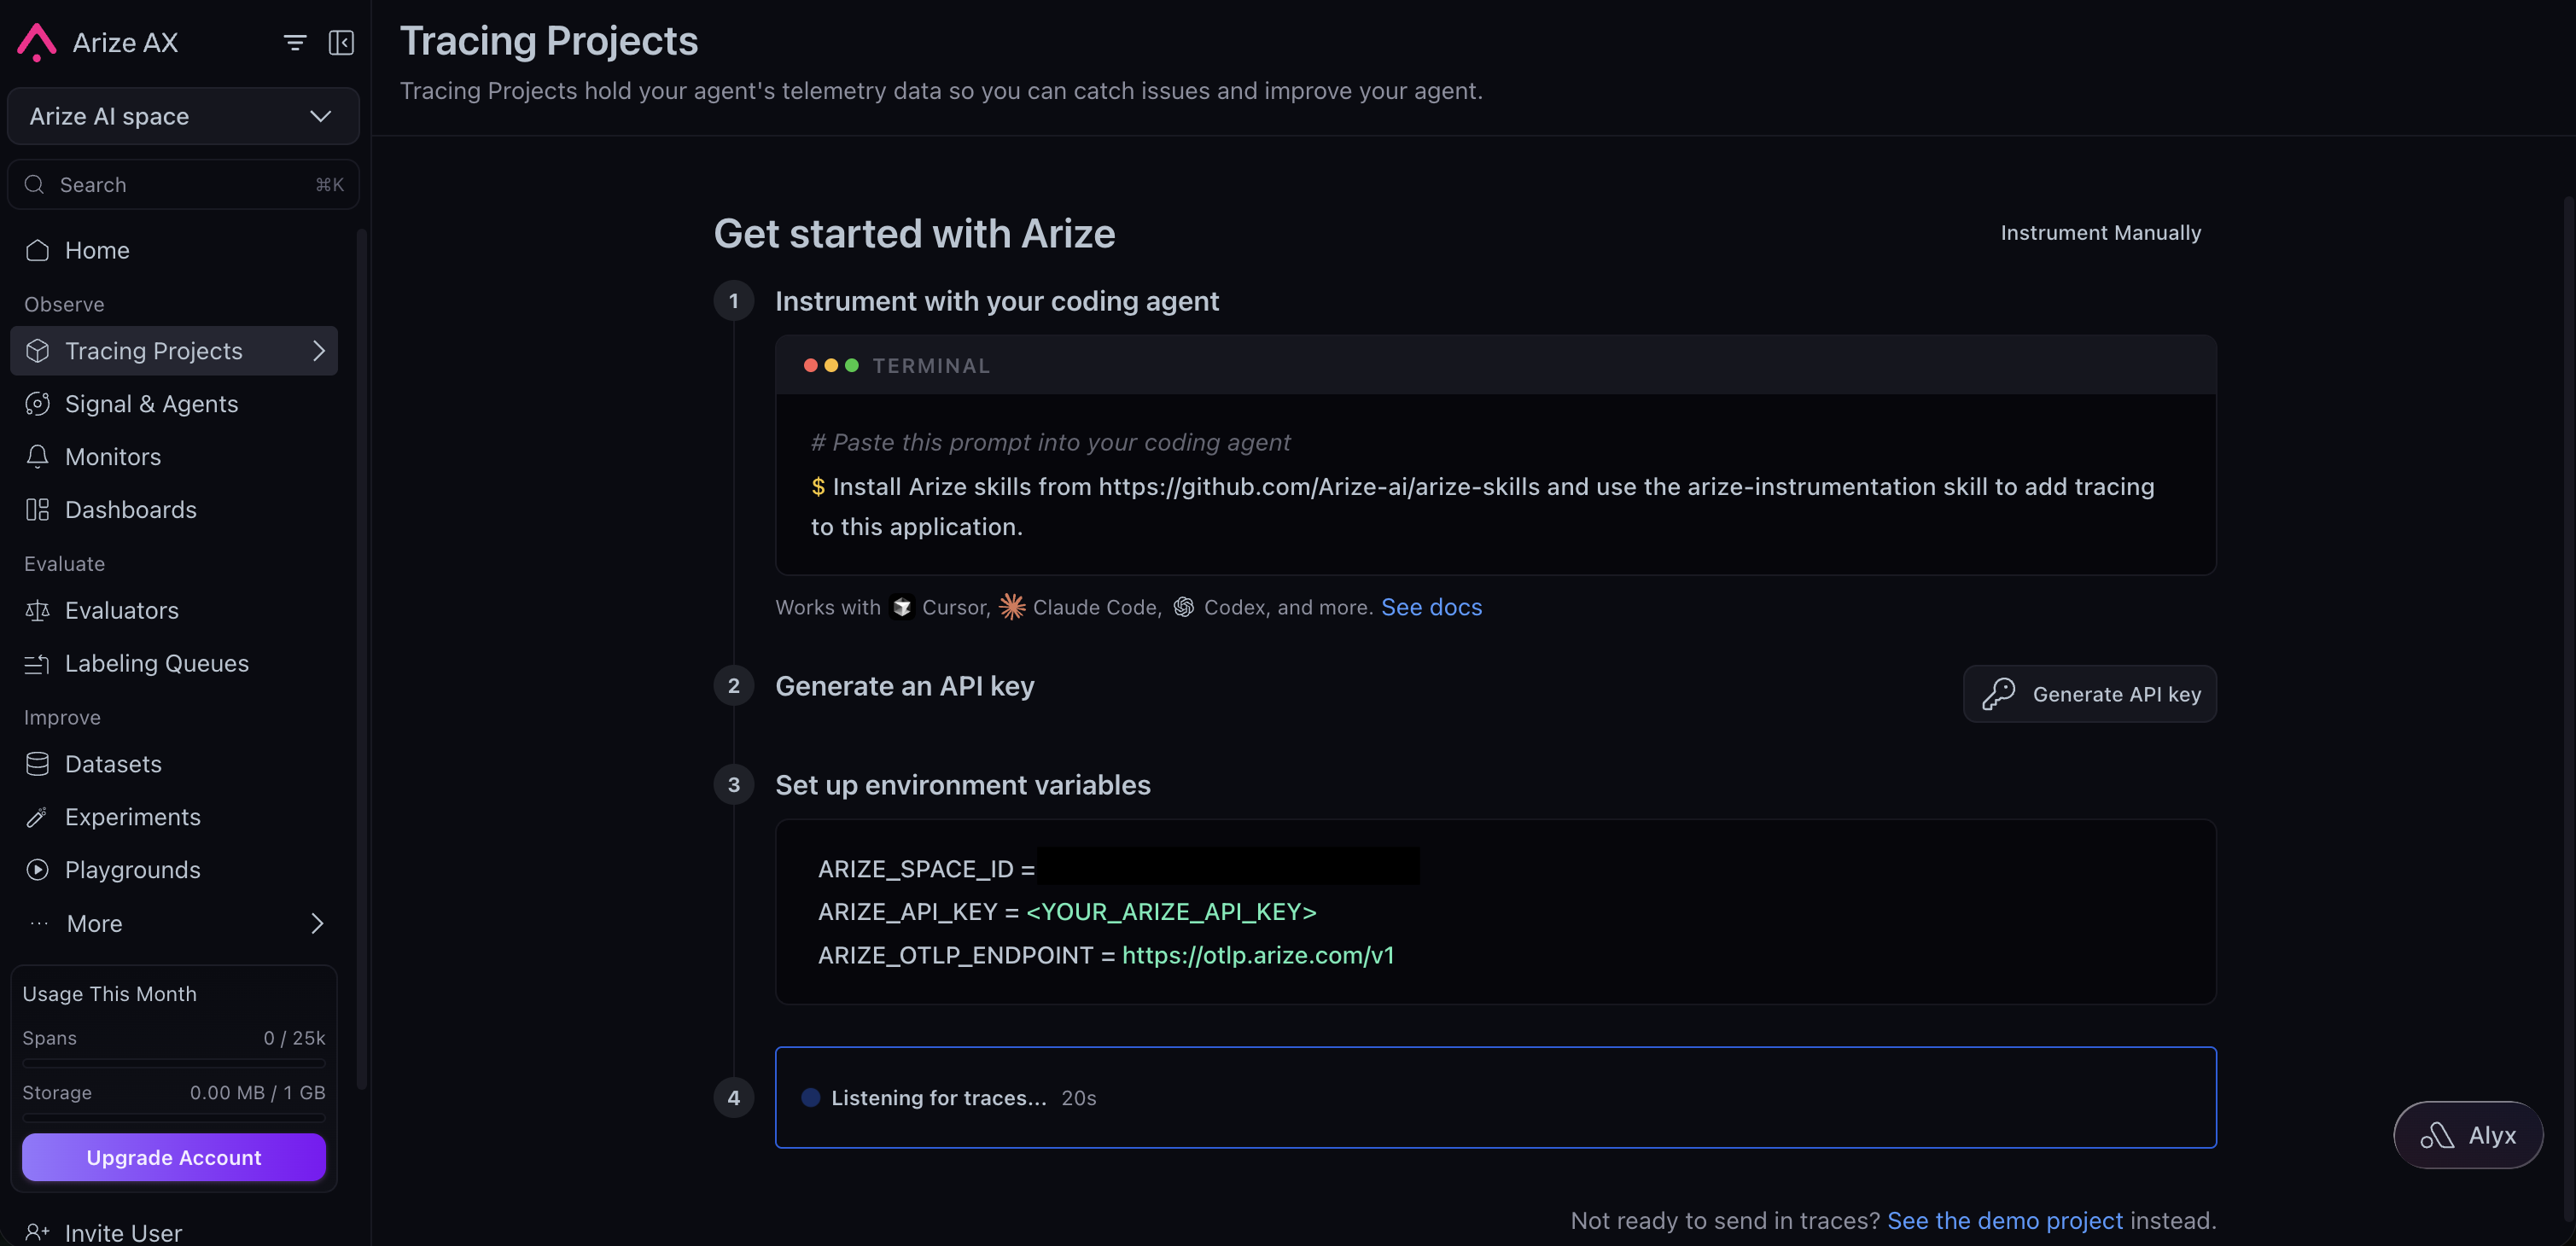
Sign in to your Arize AX account and open Tracing Projects. If you already have a project, click New Tracing Project. If you don’t, follow the steps under Get started with Arize, then click Generate API key and copy the pre-filled environment variables. Set them asARIZE_SPACE_ID and ARIZE_API_KEY when you configure your environment below to route your traces to the correct space.
Trace an agent built with the LiteLLM SDK
Prerequisites: Python 3.10 or later. The steps below instrument a small example agent, a health coach with a single tool, so the trace shows the AGENT → LLM → TOOL shape end to end. Attach the instrumentor once at startup, then wrap your agent loop and each tool call in manual spans.1
Install the dependencies
Install the LiteLLM instrumentor, the OpenInference helper used for session grouping, and LiteLLM itself.
2
Configure credentials
Set your Arize AX and provider credentials as environment variables. The tracing setup reads them at startup, so you keep secrets out of your source.
ARIZE_PROJECT_NAME is the project your traces land in. Name it for the app so runs stay grouped where you expect them. Set the provider key that matches the model string you call.3
Auto-instrument LiteLLM
Set up tracing in a dedicated module so it runs once, before your agent calls LiteLLM. This registers a tracer provider with your Arize credentials and attaches the LiteLLM instrumentor, which captures every
completion() call as an LLM span.instrumentation.py
4
Trace the agent loop
This is an ordinary LiteLLM tool-use loop with tracing added around it. The tracing is the two In your own app, call
tracer.start_as_current_span(...) blocks and their attributes; the completion() call and the tool dispatch are the code you already have. Wrapping the loop in an AGENT span and each tool execution in a TOOL span is the second of the two instrumentation moves. The completion() calls run inside the AGENT span, so the instrumentor’s LLM spans nest underneath it automatically. The OpenInference attributes are set as string keys ("openinference.span.kind", "input.value").run_agent from wherever you handle input. The last two lines run it as a one-off script; force_flush() matters only for short-lived processes, since long-running services flush on their own.5
Group traces by conversation
To follow a multi-turn conversation as a single thread, tag its runs with a shared session ID that is stable for the conversation, such as the user or thread ID. Wrap the existing Arize AX groups the tagged runs together, so you can replay a full conversation.
run_agent call in the using_session() context manager, one line, and every span emitted inside, manual and auto, carries the same session.id.6
Verify in Arize AX
Open your Arize AX space and select the project you set in
ARIZE_PROJECT_NAME. Within about 30 seconds of a run, a new trace appears with this shape:- An AGENT root span (
health-coach) carrying the user input and final answer. - One or more LLM child spans, one per
completion()call, with the prompt, response, model name, and token counts filled in automatically by the LiteLLM instrumentor. - A TOOL child span for each tool the agent ran, with the tool inputs and outputs.
Trace the LiteLLM Proxy
The LiteLLM Proxy is a standalone gateway that exposes an OpenAI-compatible API and routes requests to any provider. Because clients talk to the gateway over HTTP, the in-process instrumentor never sees those calls. Instead, the Proxy exports to Arize AX through its own native callback, so every request routed through the gateway is captured as an LLM span regardless of which language or SDK the client uses.1
Install the Proxy
Install the gateway alongside the OpenTelemetry packages the Install both: the gateway does not pull in the OpenTelemetry SDK on its own, and without it the callback fails to start and no traces are sent.
arize callback exports through.2
Enable the Arize callback
Register
arize as a callback in your gateway configuration. The Proxy reads your Arize credentials from the environment and exports a span for every routed request.config.yaml
3
Configure credentials
Set your Arize AX and provider credentials in the environment the gateway process runs in. The The callback reads
arize callback reads them at startup.ARIZE_SPACE_ID, ARIZE_API_KEY, and ARIZE_PROJECT_NAME, then exports spans to Arize AX over OTLP.4
Run the gateway
Start the gateway with your config using the The gateway starts on
litellm command.http://localhost:4000 by default.5
Send a request through the gateway
Point any OpenAI-compatible client at the gateway URL and call the model name you defined in
config.yaml.6
Verify in Arize AX
Open your Arize AX space and select the project you set in
ARIZE_PROJECT_NAME. Within about 30 seconds, a trace appears with an LLM span for the routed request, carrying the prompt, response, model name, and token counts.The gateway captures the model call. To also see AGENT and TOOL spans, add the manual spans shown in Trace an agent built with the LiteLLM SDK to the client that calls the gateway.What gets captured
The two layers combine into one trace:- LLM spans (automatic). The LiteLLM instrumentor records each
completion()call: prompt, response, the tool calls the model emits, the model name, and token usage. The same instrumentor coversacompletion(),completion_with_retries(),embedding(),aembedding(),image_generation(), andaimage_generation(). - AGENT and TOOL spans (manual). Your spans record the loop as a whole and each tool execution, so the trace shows what the agent decided to do and what each tool returned, not just the raw model calls.
- Session grouping. The
session.idyou set threads related runs into one conversation.
completion() calls run inside it.
Troubleshooting
- No traces in Arize AX. Confirm
ARIZE_SPACE_IDandARIZE_API_KEYare set in the same shell that runs your app. Enable OpenTelemetry debug logs withexport OTEL_LOG_LEVEL=debugand rerun. - LLM spans missing.
LiteLLMInstrumentor().instrument(...)must run before the firstcompletion()call. Import the tracing module first. - LLM spans not nested under the agent span. The
completion()call must run inside the active AGENT span. Keep it inside thewith tracer.start_as_current_span(...)block. 401from the provider. LiteLLM picks the provider from themodelstring (anthropic/...,openai/...,groq/...). Make sure the matching key (ANTHROPIC_API_KEY,OPENAI_API_KEY, etc.) is set.- A short-lived script exports nothing. Spans are batched by default, so a script that exits right after the run can quit before they flush. Call
tracer_provider.force_flush()before the process exits. Long-running apps and servers flush on their own. wrap_function_wrapper() got an unexpected keyword argument 'module'. Awrapt2.x release changed that function’s signature, which older instrumentor pins do not yet account for. Pinwraptbelow 2 until the pins catch up:pip install "wrapt<2".- Proxy traces missing. Confirm
callbacks: ["arize"]is underlitellm_settingsinconfig.yaml, and that the gateway process hasARIZE_SPACE_IDandARIZE_API_KEYset. The Proxy logsinitializing callbacks=['arize']on startup when the callback is registered. - Proxy logs
Error initializing custom logger: No module named 'opentelemetry'. Thearizecallback needs the OpenTelemetry SDK, which thelitellm[proxy]extra does not install. This error is non-blocking, so requests still succeed while no traces are sent. Installopentelemetry-sdkandopentelemetry-exporter-otlp-proto-grpcas shown.
Next steps
Combine auto and manual
The general pattern for mixing auto LLM spans with manual spans.
Agent trajectory
Render the agent’s execution as an interactive graph.
Set up sessions
Group multi-turn runs into conversations with session and user IDs.
LiteLLM integration
The reference page for the LiteLLM instrumentor and provider routing.