

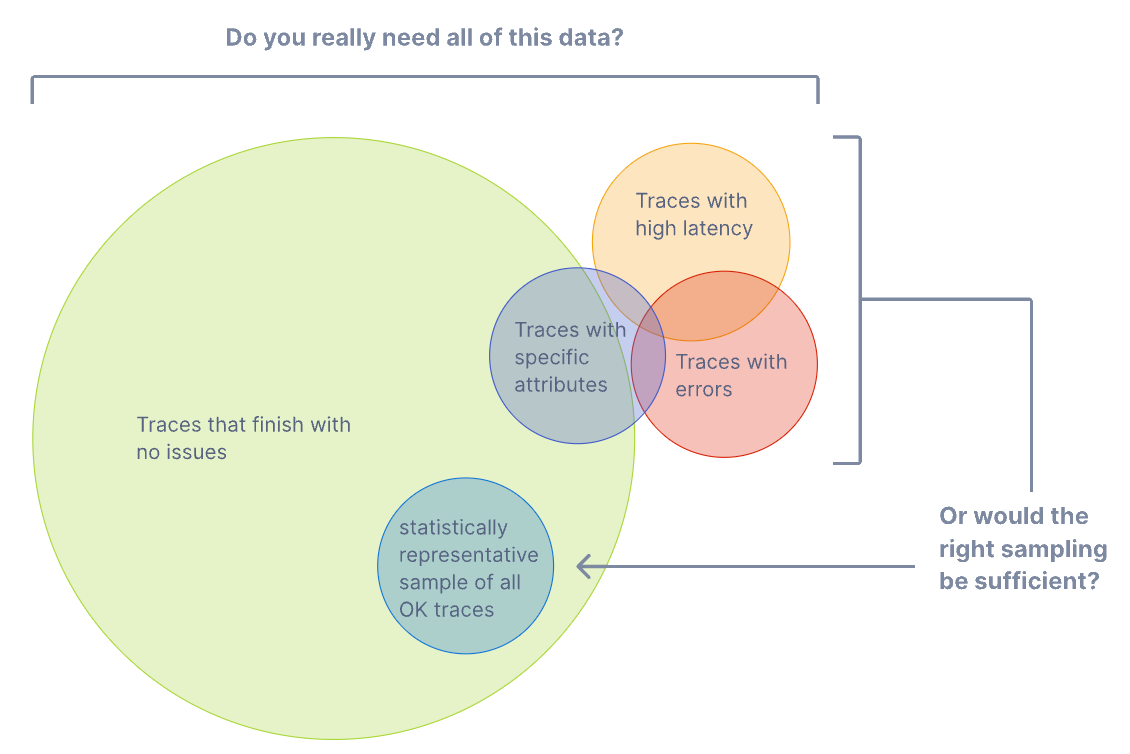
 The principle is representativeness: a smaller, well-chosen group can accurately represent a larger one. Sampling 20% of traces doesn’t mean you only see 20% of failures — it means you see a statistically representative sample of your application’s behavior.
There are two approaches: head sampling and tail sampling. They differ in when the sampling decision is made.
The principle is representativeness: a smaller, well-chosen group can accurately represent a larger one. Sampling 20% of traces doesn’t mean you only see 20% of failures — it means you see a statistically representative sample of your application’s behavior.
There are two approaches: head sampling and tail sampling. They differ in when the sampling decision is made.
Head Sampling
The decision to sample is made at the start of the trace, before any spans complete.
Head sampling is the default in the OTel SDK. The most common samplers:
ALWAYS_ON— sample every trace.ALWAYS_OFF— sample nothing.TraceIdRatioBased(p)— samplepfraction of traces, deterministically based on trace ID.ParentBased(...)— defer to the parent’s sampling decision when there is one; otherwise fall through to the wrapped sampler.
ParentBased is what keeps distributed traces consistent — if the root service decides to sample a trace, downstream services see that decision in the trace context and respect it, so the whole trace lives or dies together.
Tail Sampling
The decision to sample is made after the trace has completed, when all spans are available.
Tail sampling lives at the Collector layer, not in the SDK — see OTel Collector for the deployment pattern.
Configuring Sampling via Environment Variables
The OTel SDK reads sampler configuration from environment variables — useful for tuning sampling at deploy time without changing code.
The static samplers:
always_on— sample every trace.always_off— sample no traces.
traceidratio— sample a fraction of traces. Each span is sampled independently, which can break distributed traces (downstream services may drop spans the root service kept).parentbased_traceidratio— sample a fraction at the root, then respect the parent’s decision everywhere else. Keeps or drops the entire trace consistently. Use this for distributed systems.