
Documentation Index

Fetch the complete documentation index at: https://arize-ax.mintlify.dev/docs/llms.txt

Use this file to discover all available pages before exploring further.

OpenTelemetry organizes telemetry into a handful of signals — the three you’ll encounter most often are traces, metrics, and logs. Traces are the focus for AI applications: they’re how you see what your app did, step by step, for a single request. Spans are the building blocks of a trace. Traces group into sessions when you’re tracking multi-turn conversations. This page covers the data shapes. The rest of the pages in this section cover the OTel and OpenInference machinery that produces and ships them.

Signals

A signal is a category of telemetry data. The three most-used signals in OpenTelemetry today:
SignalWhat it isUsed to track
TracesThe path of a request through your application. A span is the unit of work that, with its peers, forms a tree (the trace).LLM calls, tool invocations, retrievals, agent steps.
MetricsA measurement captured at runtime.Aggregates like latency percentiles, request counts, token usage over time.
LogsA recording of an event.One-off events, errors, audit entries.
Each signal has its own exporter and provider. The OpenTelemetry specification also defines baggage as a signal, with events and profiles in development — see the OpenTelemetry signals documentation for the current full set. Arize AX focuses on traces, since traces are what make AI application behavior legible.

Span Structure

A span is a structured log representing a single unit of work — one LLM call, one tool invocation, one retrieval. It’s the atomic unit of a trace, and it carries everything you need to understand what happened:
FieldDescription
NameA short label for the operation (e.g. chat.completion, retrieve_docs).
Start and end timestampsWhen the operation began and finished.
Span contextAn immutable object representing the span’s identity. Contains the span ID, trace ID, trace flags, and trace state.
Parent span IDThe ID of the parent span. Empty for a root span.
AttributesKey-value pairs describing what happened. This is where the OpenInference semantic conventions live (llm.model_name, llm.input_messages, input.value, etc.).
Span eventsStructured log messages attached to a span at a specific moment.
Span linksPointers to related spans in other traces.
Span statusOk, Error, or Unset.
Span kindThe category of operation. OTel defines its own kinds for network spans; OpenInference adds AI-specific kinds — see Span Kinds.
For the canonical specification, see Span Structure.

Spans, Traces, and Sessions

Spans, traces, and sessions form a three-level hierarchy. The analogy that often helps:
A session is a conversation. A trace is one turn — one user input, one bot output. The spans inside the trace are the steps that produced that output.

Span

The individual step the application takes. Spans can be nested via parent_id:
  • Child spanparent_id equals the span ID of another span in the same trace.
  • Root spanparent_id is null. The top of the tree.
  • Orphan spanparent_id references a span that doesn’t exist in the project. Usually a sign of incomplete instrumentation or context propagation gone wrong.
Arize AX UI behavior: Arize AX reads the trace-level input and output from the root span. If your root span doesn’t have input.value and output.value set, the trace list view will show those columns as blank — even if child spans have rich data. This matters most for manually built traces; auto-instrumentors usually set them correctly.

Trace

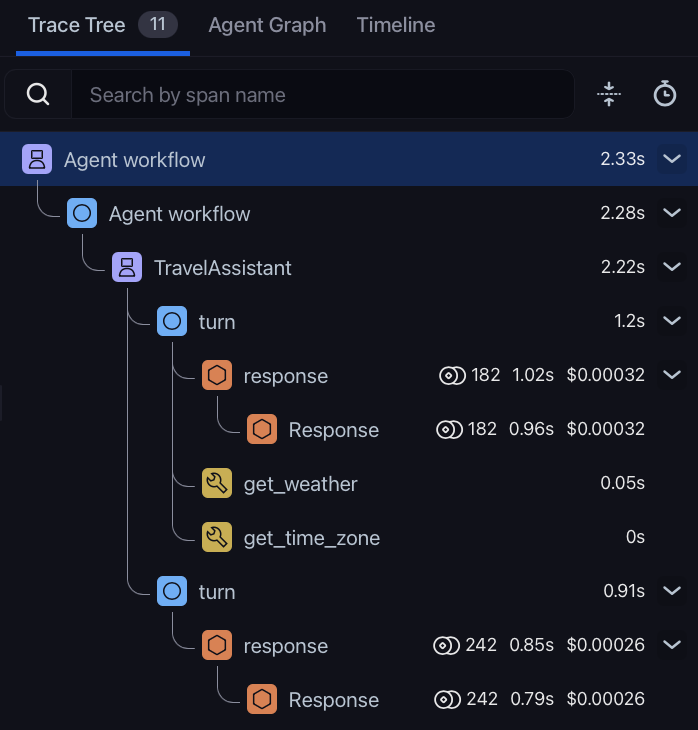
A collection of spans sharing the same trace_id. One trace represents the end-to-end work for a single request — a single user turn in a chat, a single API call, a single agent run. Trace in Arize AX from the OpenAI Agents SDK example, showing agent, chain, tool, and LLM spans nested together
Session

A collection of traces sharing the same session.id. A session typically represents a multi-turn conversation — every user message and every bot response across that conversation is its own trace, all linked together by a shared session ID. You set session.id on your spans either: For practical setup, see Set up sessions.

How They Fit Together in a Trace

In a typical AI application, a single user turn might produce a trace that looks like this:
Session (session.id = "user-42-conv-7")
└── Trace (one user turn)
    └── Agent span                                         [root]
        ├── LLM span        "decide which tool to call"
        ├── Tool span       "search the knowledge base"
        │   └── Retriever span
        └── LLM span        "answer using retrieved docs"
Each span has its own attributes (model name, input/output, token counts), its own status, and its own start/end time. The tree structure comes entirely from parent_id references, and the Arize AX UI renders it visually so you can drill into any span to see exactly what happened.

Next step

You know what spans, traces, and sessions are. Next, the first of the four OTel tracing components — the Resource, which describes who is producing the telemetry:

Next: Resource